

For laboratory managers navigating the complexities of high-throughput molecular diagnostics, rigorous monitoring of key performance indicators (KPIs) is fundamental for evaluating operational efficiency and maintaining regulatory compliance. High-throughput laboratories operate under high pressure to process large volumes of samples without compromising precision.
Conventional KPIs may not fully reflect the complexity of molecular diagnostic workflows. Molecular diagnostic laboratories encounter distinct challenges, such as high reagent costs, contamination risks, and intricate extraction procedures. Operating with narrow margins per test, even small inefficiencies in syndromic panel testing can result in a significant financial impact
The 10 Essential KPIs for High-Throughput Labs
High-throughput molecular labs must monitor these 10 specific lab performance metrics to maintain operational efficiency and profitability.
1. Turnaround Time (TAT)
TAT is a critical laboratory metric — measuring the total duration from sample receipt to result reporting, it is the primary indicator of your lab’s responsiveness. To optimize TAT, establish clear start and end points, and segment data by sample type to identify outliers. Targeting strategies to reduce TAT often deliver a strong return on investment (ROI) in operational efficiency, as pre-analytical delays are frequently the main cause of bottlenecks.
2. Cost Per Test (CPT)
Calculate cost per test (CPT) by summing all test-related expenses, including consumables, labor, overhead, reagents, and instrument depreciation. The objective is to consistently reduce CPT to support long-term success.
Adopting a platform with flexible syndromic testing that can mask unused targets allows laboratories to report only requested targets, offering operational flexibility and minimizing unnecessary costs.
3. Test Accuracy and Reproducibility
Both accuracy and reproducibility are vital in high-throughput molecular diagnostics. The key metric to focus on is your false positive rate. A high false-positive rate may trigger unnecessary therapeutic interventions for patients and costly retesting for the lab. Often, these errors stem from “optical crosstalk” in older fluorescence-based systems, where the signals from different pathogens bleed into one another.
Transitioning to digital detection technologies that use barcoded magnetic beads manufactured via semiconducting processes greatly reduces variability, ensuring each detected signal is distinct and accurate. This gives laboratories confidence that a positive result is truly positive, enhancing both diagnostic reliability and operational efficiency.
You want the investment to be financially viable and should thus be well executed. That is why you require a structured approach to this new technology, which can be achieved through the use of a business case and a thorough implementation plan. So, regardless of whether you’ve chosen the right diagnostic tools and technology, it may fail without adequate planning.
4. Staff Productivity
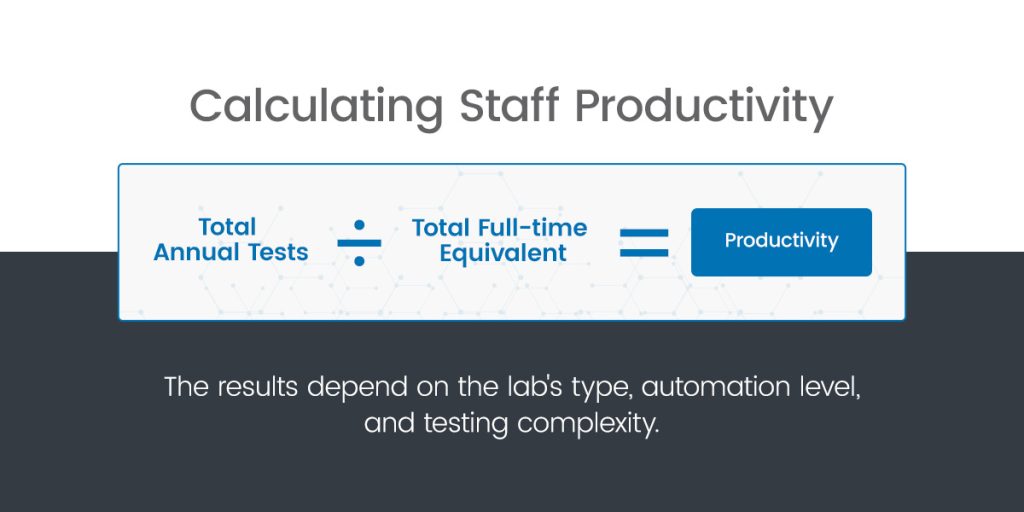
Your team also plays an integral part in your lab’s success. Understanding your staff’s throughput can provide strategic insight into your lab’s operational efficiency and workforce utilization. Measure their productivity by tracking tests per full-time equivalent (FTE). Simply divide the total annual tests by the total FTEs. The results depend on the lab’s type, automation level, and testing complexity.
It’s crucial not to use this metric to micromanage. Instead, use it to identify high performers. Pushing this metric too high may lead to burnout or increased error rates.
5. Instrument Utilization
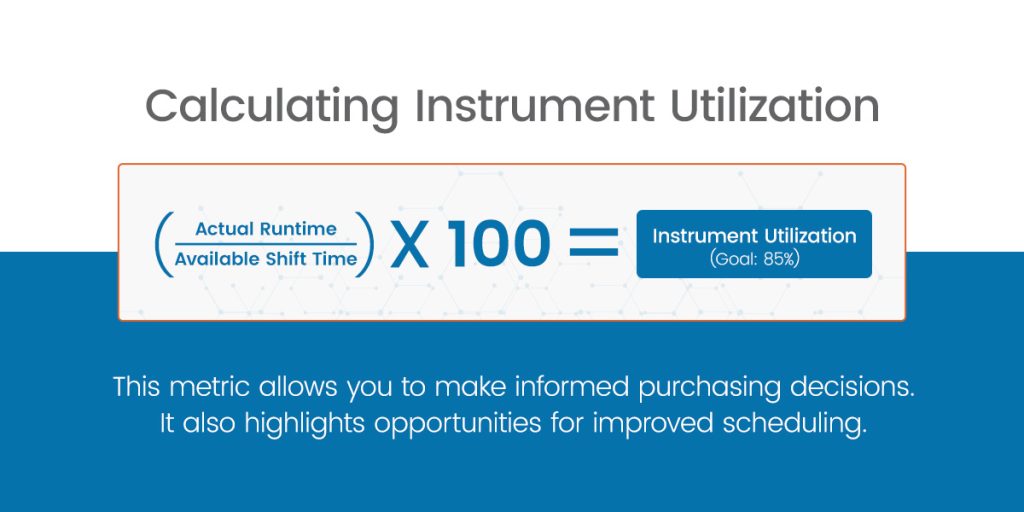
Given the substantial capital investment in laboratory instrumentation, you want to maximize ROI by efficiently using these valuable assets. Track instrument utilization by dividing an instrument’s actual runtime by the available shift time, and then multiplying by 100. Aim for about 85%. If utilization is low, it signals wasted capital, but if it’s too high, it risks bottlenecks.
This metric allows you to make informed purchasing decisions. It also highlights opportunities for improved scheduling, such as employing a high-throughput automated system designed specifically for efficient batch processing.
6. Reagent and Consumable Waste
Reagent waste is a hidden budget leak, often caused by “dead volume” – residual liquid in troughs that instruments cannot pipette. Expired kit waste must also be tracked. Buying in bulk may secure a discount, but it may not be worth it if that inventory expires before use.
7. Client Satisfaction
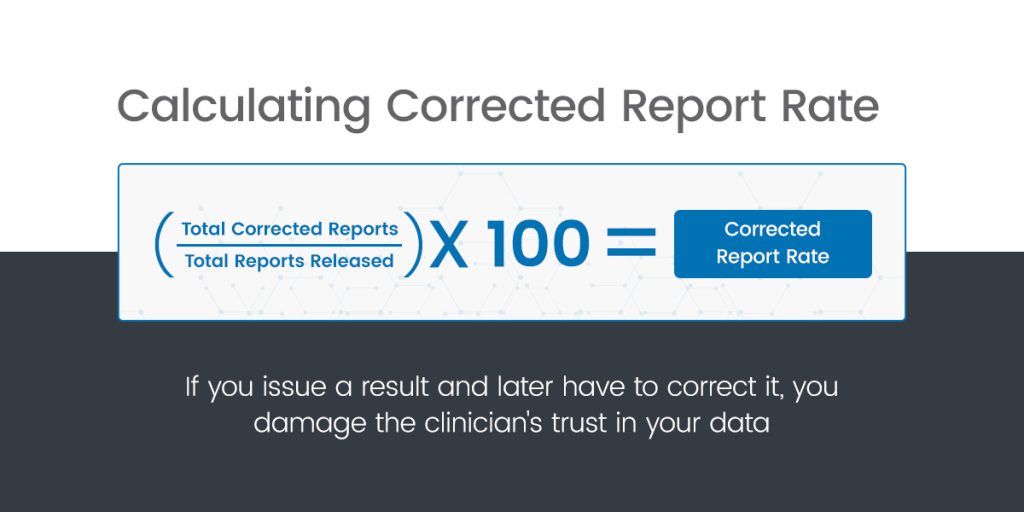
Quantify client satisfaction by tracking complaints per 1,000 accessions. Tracking these complaints will help you identify potential systemic issues before they impact client relationships. Also consider your corrected report rate (CRR). If you issue a result and later have to correct it, you damage the clinician’s trust in your data. Calculate CRR by dividing the total corrected reports by the total reports released, and then multiplying that by 100.
Even a CRR of 0.1% signals a gap in your validation process. Clinicians may forgive a higher price, but they will rarely forgive unreliable data.
8. Error Rate and Compliance
While analytical and operational complexities invariably lead to some errors, a consistently high rework rate can lower your lab’s efficiency and erode client trust. Pre-analytical errors in lab testing can make up the majority of errors. Note that, unlike test accuracy, this metric focuses on operational workflow.
Beyond daily errors, you must also track your proficiency testing (PT) score. Regulatory bodies such as the Clinical Laboratory Improvement Amendments (CLIA) and the College of American Pathologists (CAP) send blind samples to your lab for performance verification. Repeated failures here can jeopardize your accreditation.
9. Revenue Per Test
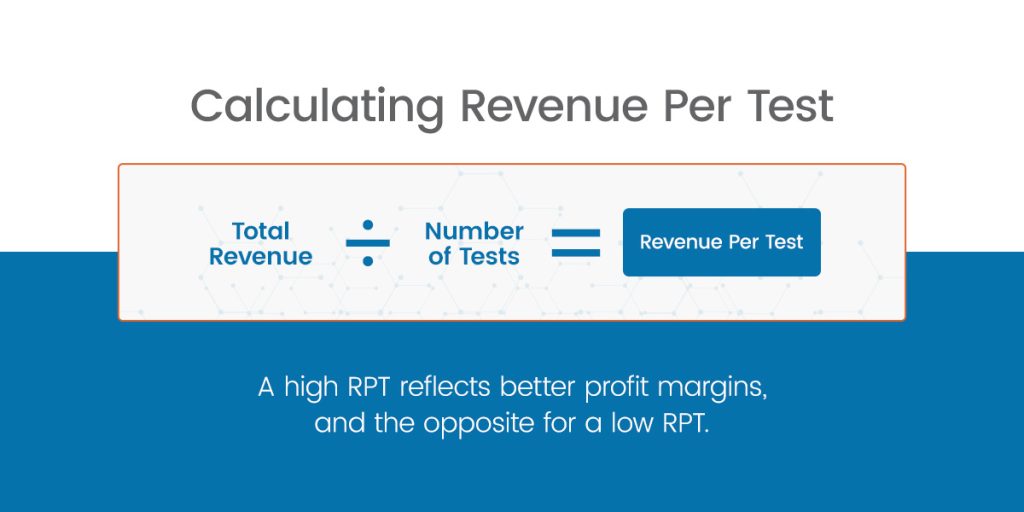
Tracking your revenue per test (RPT) can give you insight into your lab’s profitability and resource allocation. The RPT can help differentiate high-profit and low-profit tests. To calculate this metric, you divide your total revenue by the number of tests. A high RPT reflects better profit margins, and the opposite for a low RPT.
After this phase, you must have an audit-ready diagnostic method that is reproducible, accurate, and meets quality standards.
That said, compare your RPT to the test’s labor intensity. A high-revenue test might actually be a financial drain if it requires hours of manual technician time. The goal is to identify the profitability gap, which is tests that generate high revenue but run on inefficient, labor-intensive workflows.
10. Employee Satisfaction
Employee morale is the foundation of long-term success. High morale correlates with lower turnover and higher work quality. Effective strategies for assessing employee satisfaction include structured one-on-one reviews and anonymous feedback mechanisms, which are crucial for identifying challenges and fostering motivation.
How to Implement and Track Your KPIs
Your data is useless if it sits in a silo. For effective metric tracking, move away from manual spreadsheets and utilize a laboratory information management system (LIMS) to automate this process. Depending on the LIMS, you can build a dashboard that groups metrics by their required review frequency, for example:
- Daily: TAT, error rates, instrument utilization, and client complaints.
- Monthly: CPT, staff productivity, RPT, and reagent waste.
- Quarterly: Employee satisfaction and test accuracy and reproducibility.
The goal for the end of this phase is to have a stable integration of the new diagnostic method into your routine laboratory workflows.
How Applied BioCode Inc. Can Help You Improve Your Lab’s Performance
Applied BioCode Inc. can help you directly optimize multiple of these KPIs through our high-throughput, automated molecular platforms.
The BioCode® MDx-3000 System is one of our most successful multiplex molecular diagnostic (MDx) testing products. It processes up to 96 samples in a single run and runs up to three different panels simultaneously — all without compromising quality. This can directly boost your instrument utilization and staff productivity. Also, the system’s masking feature allows you to report and pay only for relevant targets within a syndromic panel, directly optimizing CPT.
BioCode® Barcoded Magnetic Beads further sets our syndromic panel testing solutions apart. Our patented BMB technology helps eliminate the ambiguity inherent in analog signals, directly improving your lab’s test accuracy and reproducibility.
Enhance Cost Efficiency and Laboratory Throughput
Tracking the key performance indicators for laboratories in molecular diagnostics is paramount for a lab’s performance. Monitoring these metrics is the first step, as you also need the right technology to optimize them. Trust Applied BioCode Inc. to be your workflow partner.
Contact our team today to learn more about how our cutting-edge molecular syndromic testing solutions can improve your lab performance metrics.
Listen to how a clinical laboratory in Florida streamlined its molecular testing workflow and reduced assay costs by a third compared to its previous assays when using the Applied BioCode MDx-3000.

References
- https://www.apbiocode.com/turnaround-time/
- https://www.apbiocode.com/syndromic-testing/
- https://www.apbiocode.com/false-positives/
- https://www.apbiocode.com/7-lab-improvement-ideas-for-better-efficiency/
- https://www.apbiocode.com/products/instruments/analyzer3000/
- https://pmc.ncbi.nlm.nih.gov/articles/PMC10981510/
- https://www.apbiocode.com/products/instruments/analyzer3000/
- https://www.apbiocode.com/technology/bmb-technology/
- https://www.apbiocode.com/contact-us/